Application dashboard
Use the application dashboard to check an application’s delivery status, deployed versions, runtime health, and ingress URLs without leaving the Core Platform UI.
Sign in and select a context
Choose Sign in with Core Platform to authenticate through Core Platform Auth. Your organisation may use a Google account brokered by Core Platform Auth or an approved local account.
If you belong to multiple contexts, use the selector in the dashboard header and choose Switch Context to change between them. Users with one context enter it directly. Each context has isolated users, GitHub connections, catalogues, connected clusters, and runtime state. Available capabilities depend on the selected context; for example, some contexts provide a static catalogue from Portal storage and others provide connected-cluster onboarding. Catalogue pages read that stored data directly: they do not wait for a Git refresh or catalogue-readiness check, and an empty catalogue is shown as empty.
Choose Log out to clear the Portal session. The Portal also attempts to end the associated Core Platform Auth session and displays a warning if Core Platform Auth cannot confirm logout.
Your GitHub connection is separate from Portal sign-in and belongs to the active Portal context. Open your profile and connect GitHub in each context where you need to perform operations using your GitHub identity.
View your contexts and roles
Open Profile from your account menu to view your context and roles. A green checkmark identifies the current context. If you belong to multiple contexts, use the selector in the dashboard header to switch between them.
The Roles section always shows user for the standard access provided by context membership, alongside any additional roles such as admin. These roles apply to the current context.
Check delivery status
Open the dashboard and go to Applications, then choose the application. The Path to Production tab shows the current version in each stage, the status of build and test jobs, and links back to the underlying delivery evidence.
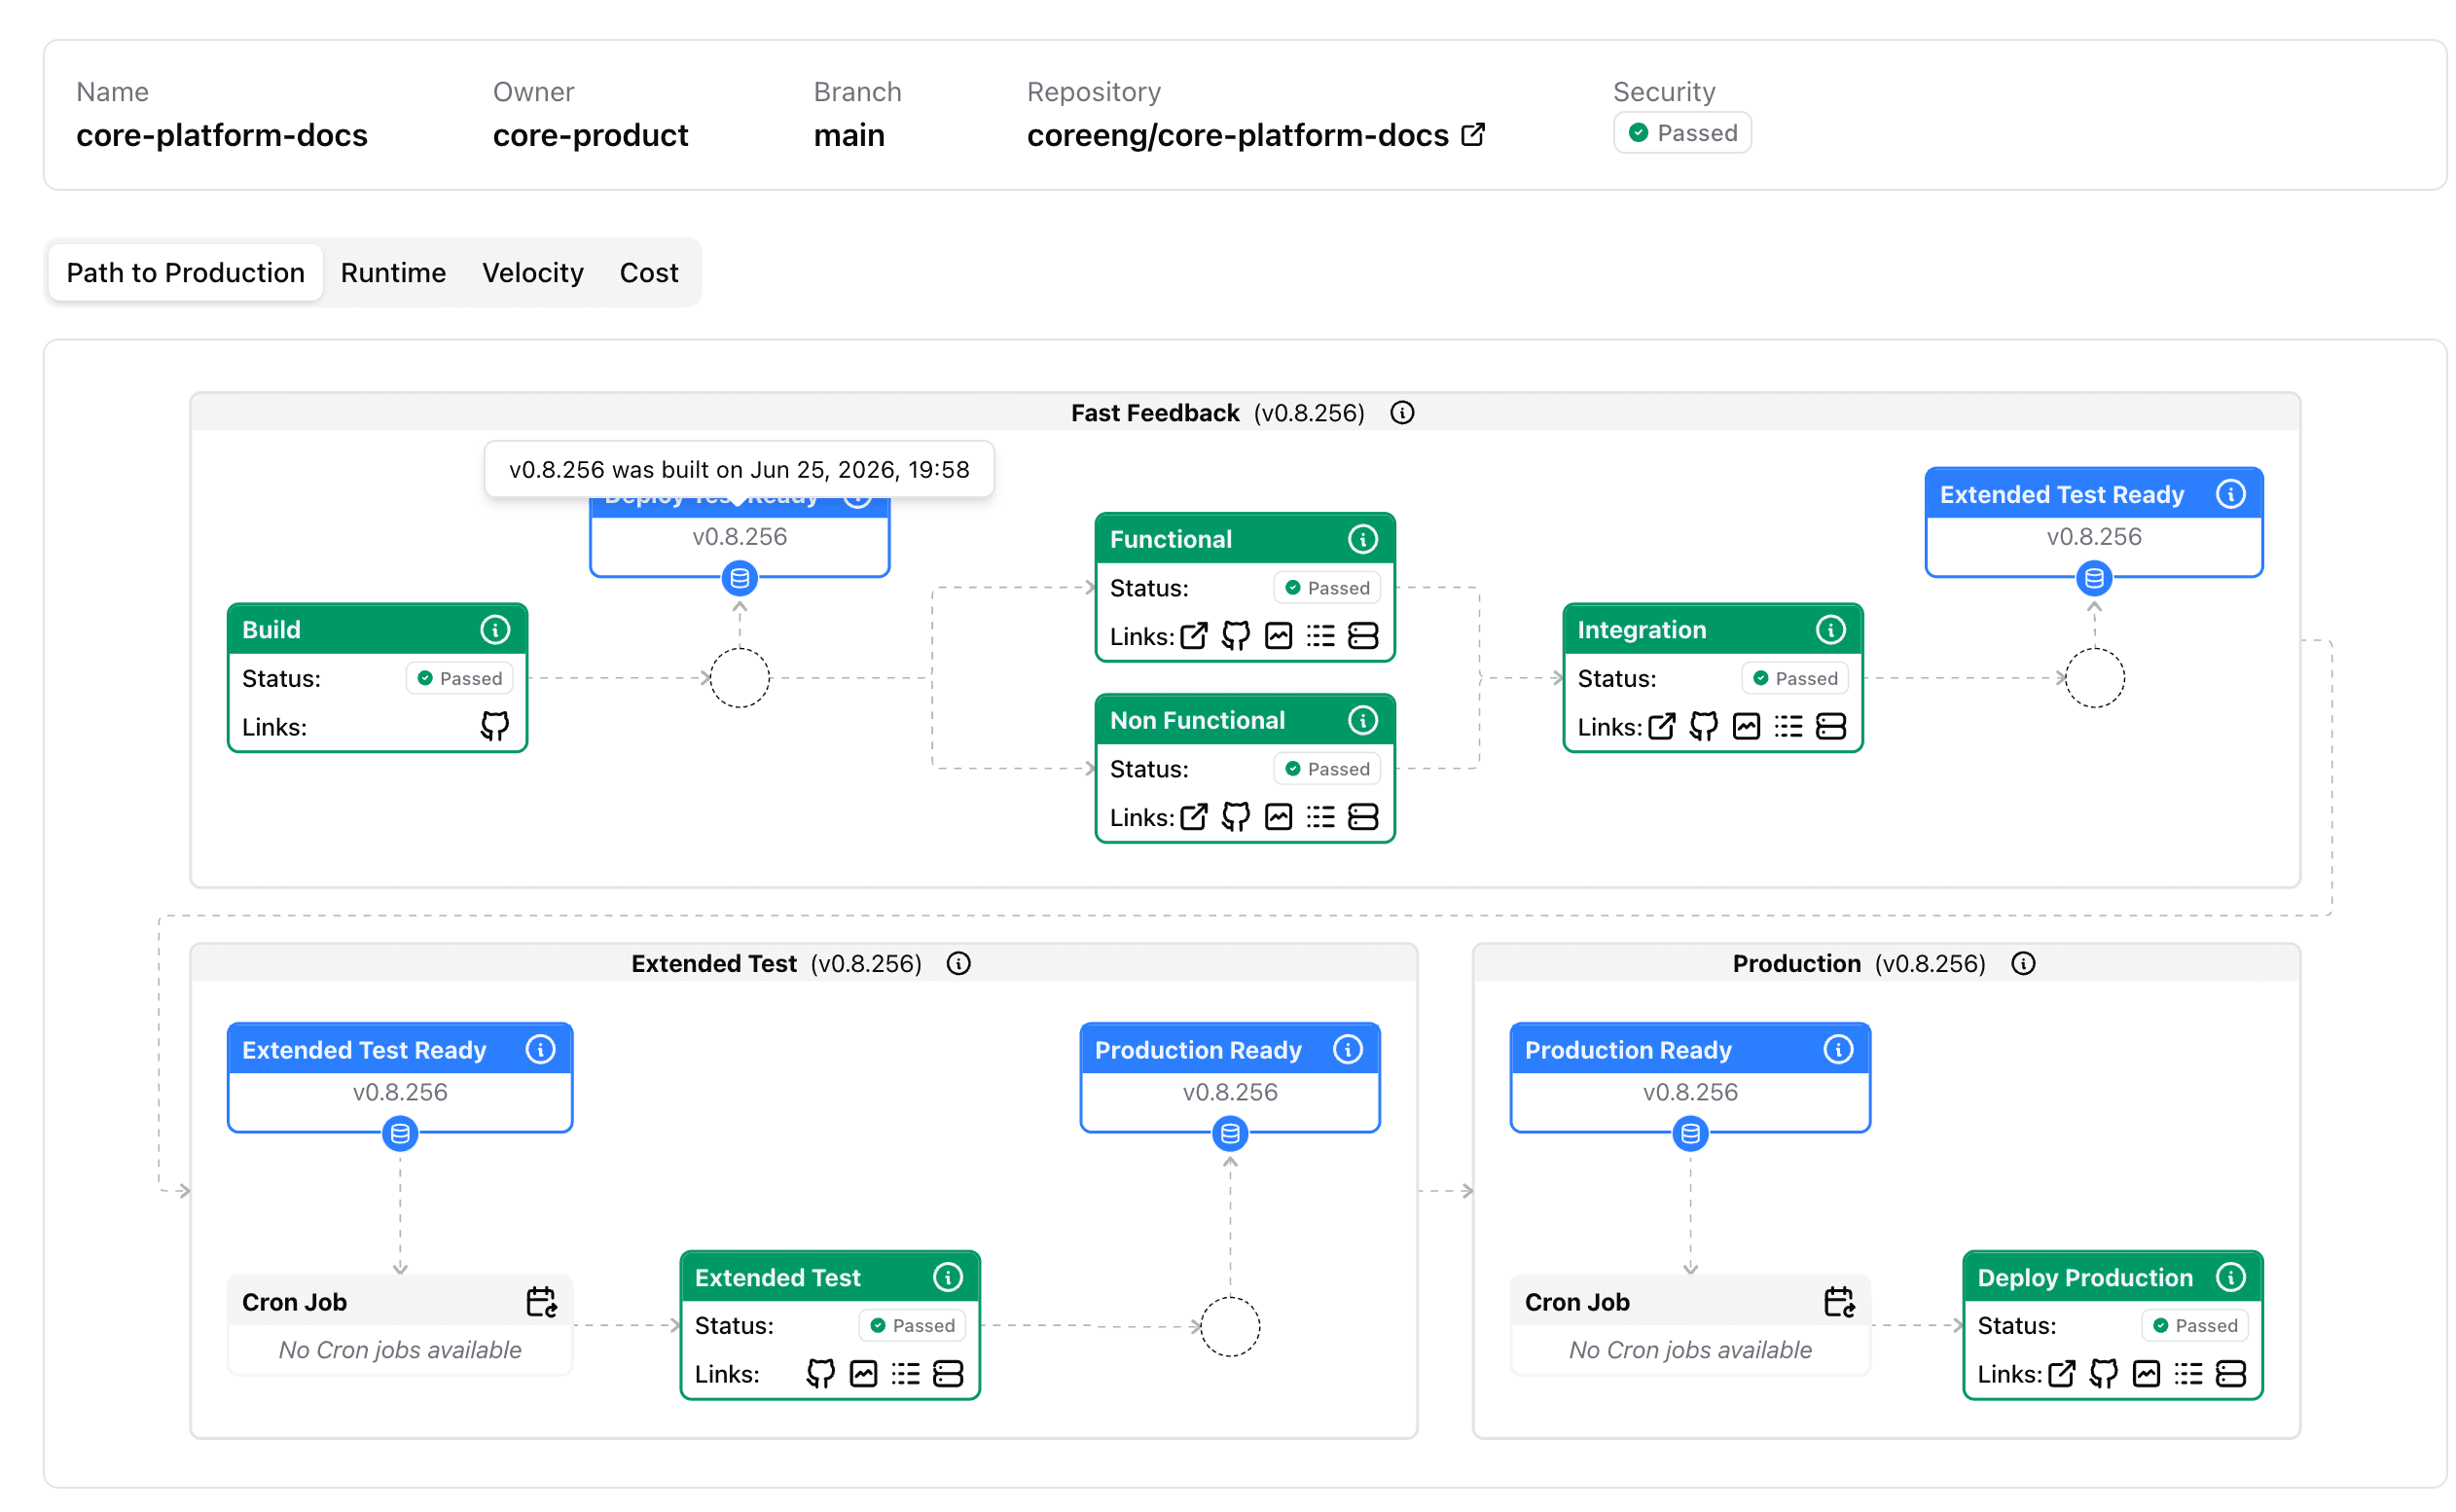
Use this view when you need to answer questions such as:
- which version is in fast feedback, extended test, or production
- whether build, functional, non-functional, integration, extended test, or production deployment has passed
- where to find the related GitHub workflow, logs, or deployment evidence
Open a managed application
Select Runtime and use the external-link icon beside a host in the ingress table. Portal ingress URLs require signing in as a member of the application’s Context and a ready managed route. The same tab shows the application’s workloads and pods.
Check runtime health
Select the Runtime tab to see replicas, pod CPU, pod memory, and the ingresses created for the application across environments.
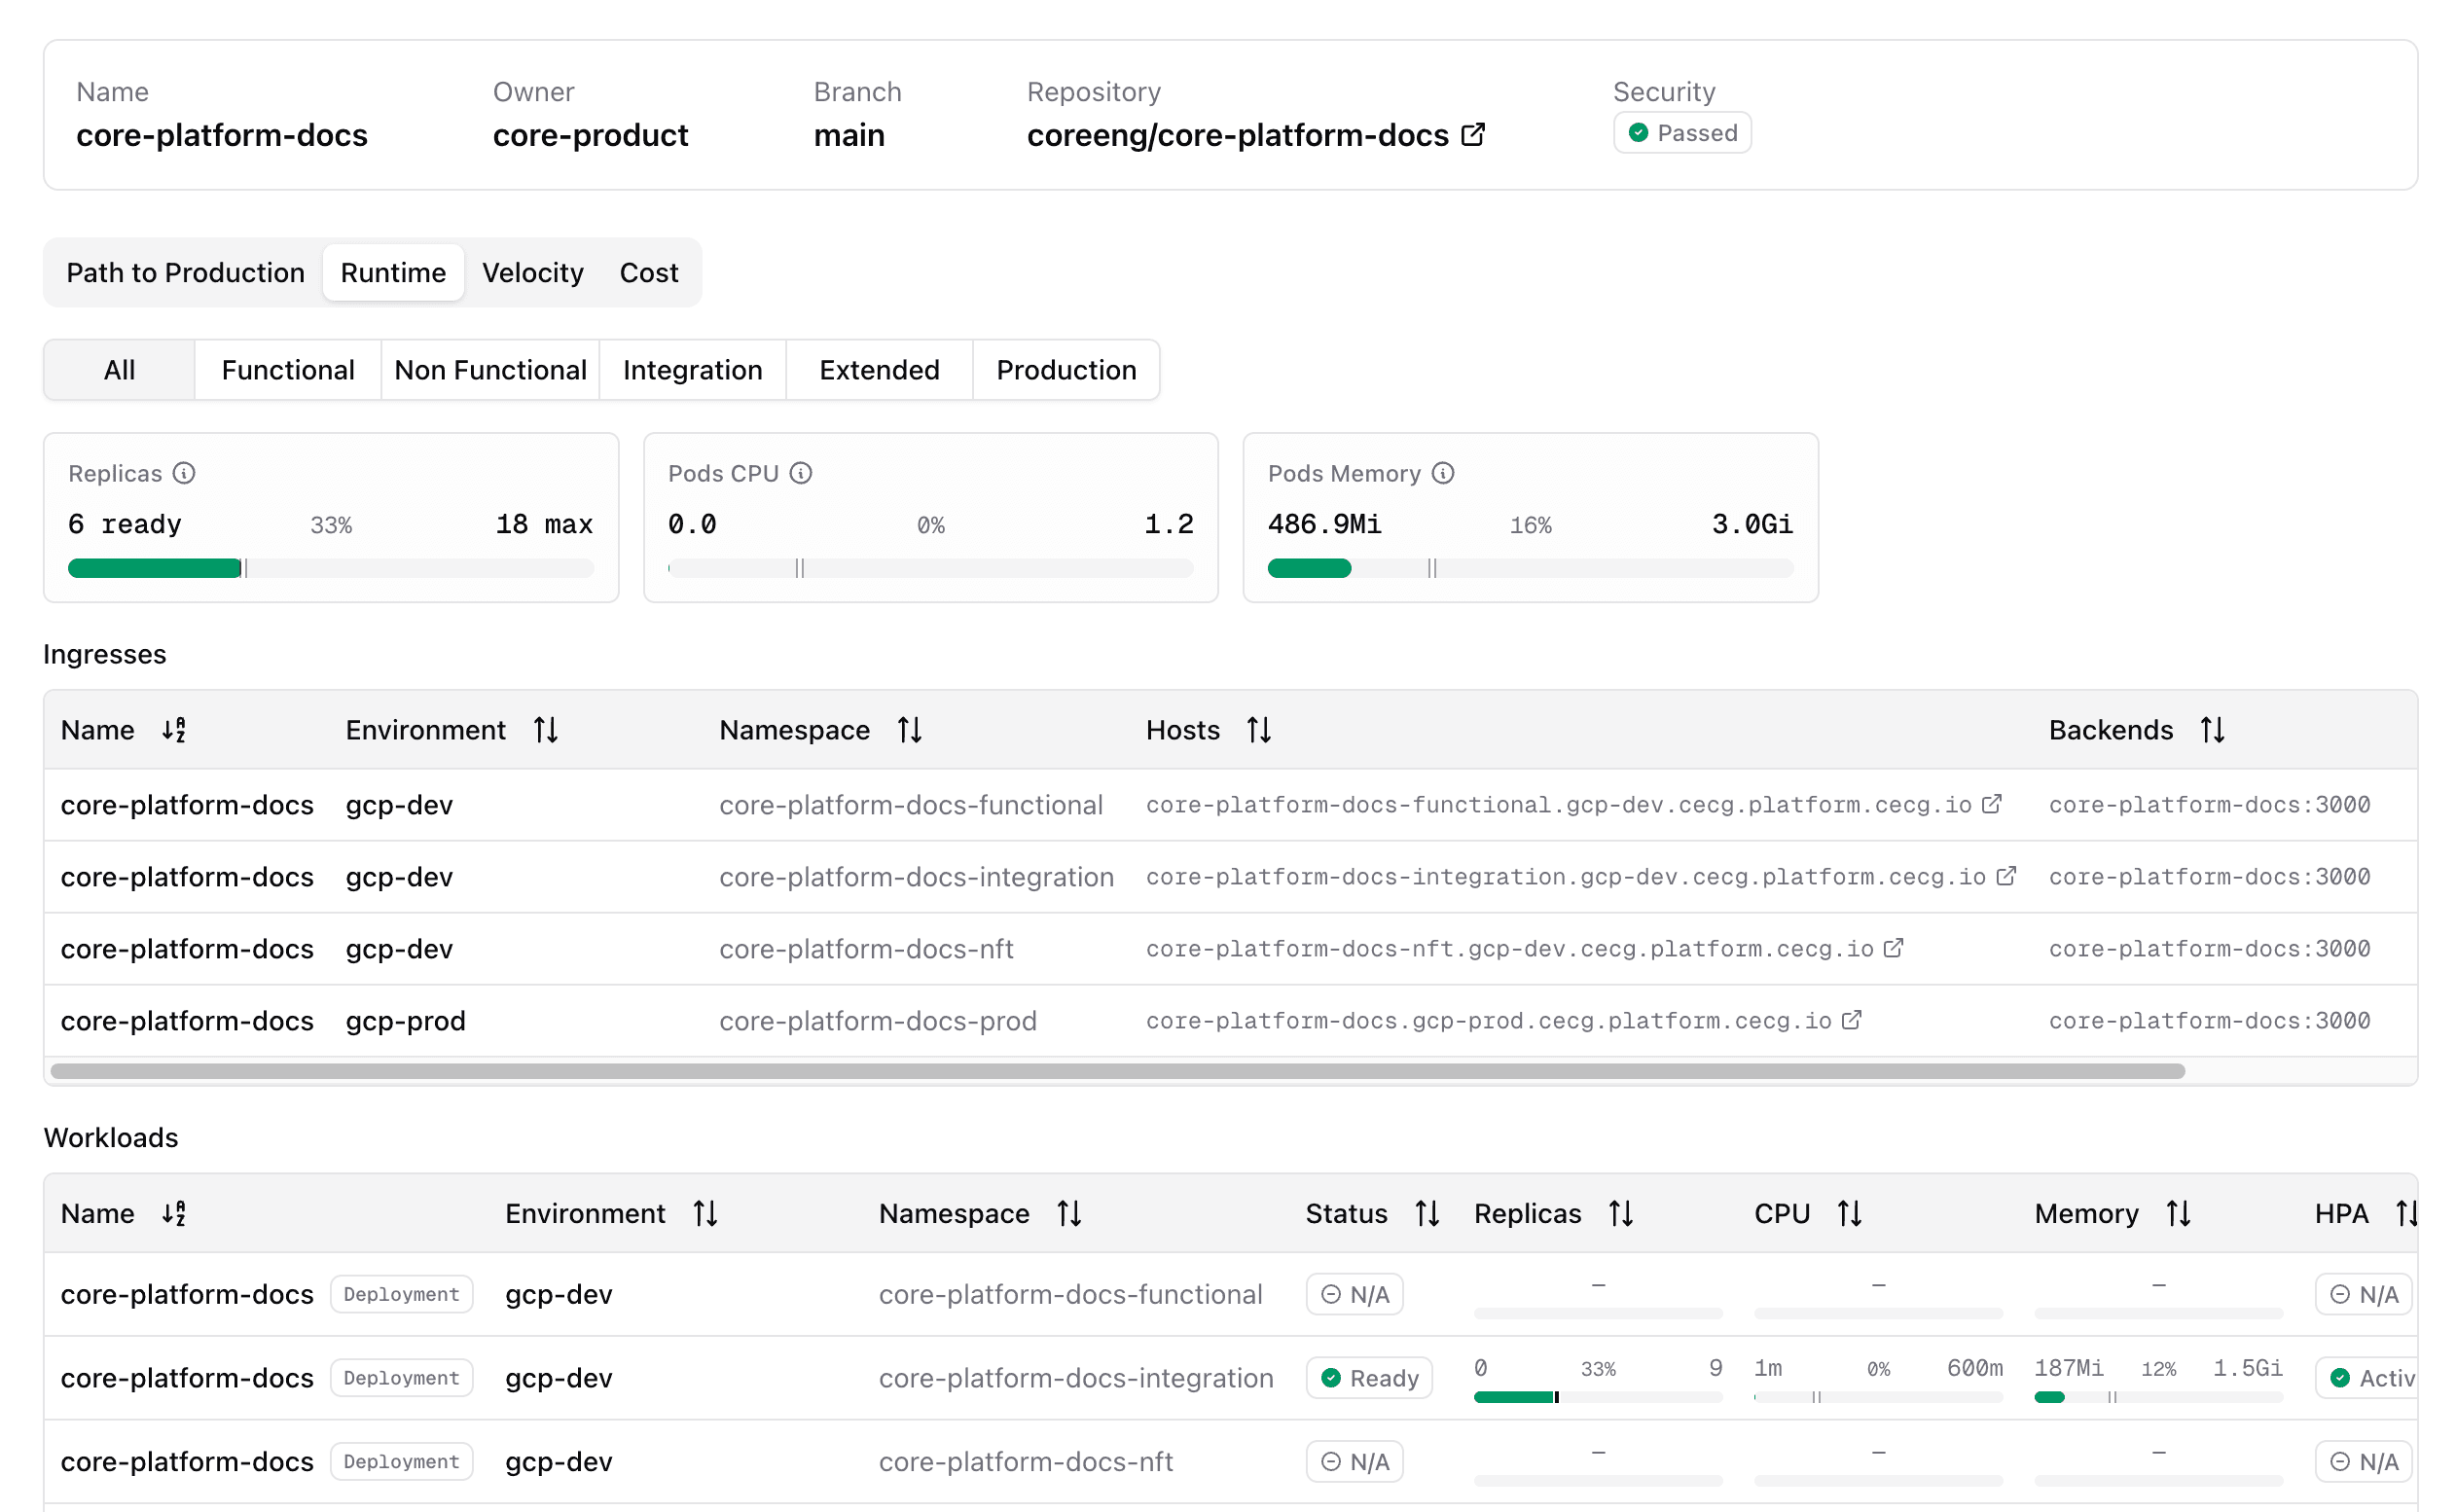
The ingress table shows the environment, namespace, host, and backend for each application ingress. Use the external-link icon beside a host to open the endpoint.
CLI alternatives
For terminal access, configure cluster access, then use kubectl:
kubectl get pods --namespace <namespace>
kubectl get ingress --namespace <namespace>
For delivery workflow details, see Path To Production.